Meal planning isn't just a kitchen habit, it's a growing response to food waste, rising grocery costs, and increasingly busy schedules. We compiled the latest statistics on meal planning from government agencies, academic research, and industry reports to paint a complete picture of how Americans eat, plan, and spend in 2026.
Whether you're a blogger writing about meal prep, a researcher studying food behavior, or someone curious about the data behind dinner, this page is a comprehensive reference. All statistics are sourced and linked below.
Key Takeaways
Food Waste Statistics
Food waste is one of the most significant (and preventable) problems in the U.S. food system. Meal planning is consistently cited as one of the most effective household-level interventions.
- 30–40% of the U.S. food supply is wasted, according to the USDA, amounting to approximately 133 billion pounds of food per year. (USDA)
- The average American household wastes approximately $1,500 worth of food per year. That's roughly $125 per month thrown in the trash. (USDA)
- Food waste is the single largest category of material in municipal landfills, making up 24% of landfill waste. (EPA)
- Households are responsible for 39% of all food waste in the U.S., making residential food waste larger than waste from restaurants, grocery stores, or farms. (ReFED)
- Over-preparation and failure to use leftovers account for most household food waste. The top reasons cited are food spoiling before it can be eaten and cooking too much. (ReFED)
- Reducing food waste by just 15% could feed more than 25 million Americans each year. (NRDC)
- 21% of U.S. freshwater is used to produce food that is never eaten. Food waste has a significant environmental footprint beyond the food itself. (NRDC)
- If food waste were a country, it would be the third-largest emitter of greenhouse gases behind the U.S. and China. (FAO)
Grocery Spending Statistics
Grocery prices have climbed significantly in recent years. Here's how much Americans are spending, and how meal planning can help.
- The average U.S. household spends $270 per week on food, including $179 on groceries and $91 on dining out. (Bureau of Labor Statistics)
- Food-at-home prices have risen approximately 25% since 2019, with staples like eggs, bread, and dairy seeing some of the largest increases. (BLS Consumer Price Index)
- 83% of Americans say they are concerned about the cost of groceries. Rising prices are the top food-related concern for households across income levels. (Pew Research Center)
- Americans make an average of 1.6 trips to the grocery store per week. Unplanned trips are strongly correlated with impulse purchases and higher overall spending. (FMI – The Food Industry Association)
- Households that meal plan spend approximately 23% less on groceries compared to those that don't plan meals in advance. (USDA)
Meal Planning Adoption Statistics
Meal planning is gaining traction, but most people still struggle to stick with it. The data reveals a gap between intention and execution.
- About 1 in 3 Americans plan their meals for the week in advance. The rest rely on deciding day-of or improvising. (Morning Consult)
- 64% of Americans say they want to cook at home more often. Barriers include time, lack of ideas, and the effort of deciding what to make. (Pew Research Center)
- The #1 barrier to meal planning is "it takes too much time," cited by 41% of respondents in a national cooking habits survey. (Statista)
- About half of people who start meal planning quit within the first month. Rigid systems that require assigning specific meals to specific days are the most commonly abandoned. (HelloFresh Consumer Survey)
- 52% of home cooks say "lack of recipe ideas" is their biggest cooking challenge. Deciding what to cook is often harder than actually cooking. (Statista)
- Millennials are the most likely generation to meal plan, with 38% reporting weekly meal planning habits compared to 29% of Gen X and 22% of Baby Boomers. (Morning Consult)
- The global meal planning app market is growing at approximately 15% CAGR, reflecting increasing consumer demand for digital tools that simplify meal decisions. (Business Research Insights)
Time Spent on Food & Cooking
Americans spend a significant chunk of each day on food-related activities, from deciding what to eat to shopping, prepping, and cooking.
- The average American spends 37 minutes per day on food preparation and cleanup. This varies significantly by gender: women average 50 minutes while men average 22 minutes. (American Time Use Survey, BLS)
- Grocery shopping takes an average of 41 minutes per trip, not including travel time to and from the store. (American Time Use Survey, BLS)
- People who meal plan report saving 3–4 hours per week on food-related decisions, shopping, and last-minute meal scrambles. (Food & Nutrition Magazine)
- The average person makes 200+ food-related decisions per day, most of them subconscious. Decision fatigue around meals is a well-documented phenomenon. (Cornell University Food and Brand Lab)
Health & Nutrition Impact
The connection between meal planning and healthier eating is well-supported by research.
- People who meal plan have significantly better diet quality and greater food variety compared to non-planners, according to a study published in the International Journal of Behavioral Nutrition and Physical Activity. (IJBNPA, 2017)
- Home-cooked meals contain roughly 50% fewer calories than comparable restaurant meals, primarily due to smaller portions and less added fat and sodium. (Johns Hopkins Bloomberg School of Public Health)
- 91% of Americans believe that home-cooked meals are healthier than eating out. Despite this, most eat out or order delivery 4–5 times per week. (International Food Information Council)
- People who cook at home 6–7 times per week consume 140 fewer calories per day on average compared to those who cook once a week or less. (Public Health Nutrition)
- 36% of Americans say they are actively trying to eat healthier, but only 19% use a meal plan or structured approach to achieve that goal. (IFIC Food & Health Survey)
Meal Kit & Recipe App Market
The market for meal planning tools (from meal kits to recipe apps) has grown rapidly as consumers look for easier ways to solve the "what's for dinner?" problem.
- The global meal kit delivery market is valued at over $20 billion and continues to grow, driven by demand for convenience and reduced food waste. (IBISWorld)
- More than 1 in 5 U.S. adults have tried a meal kit service. However, retention remains a challenge: the most common reason for canceling is cost. (Morning Consult)
- Recipe and meal planning apps have seen a 40% increase in downloads since 2022, reflecting growing consumer interest in digital tools for home cooking. (Business Research Insights)
- The average meal kit costs $9–12 per serving, making it 2–3x more expensive than cooking from scratch with a planned grocery list. (IBISWorld)
Social Media & Recipe Discovery
Social media has become a dominant channel for recipe discovery, especially among younger consumers.
- 40% of Gen Z and Millennials discover new recipes primarily through social media, surpassing cookbooks, food blogs, and TV cooking shows. (Statista)
- The hashtag #recipe has accumulated over 50 billion views on TikTok, making food one of the platform's top content categories alongside entertainment and beauty. (TikTok)
- 62% of people who save recipes from social media never actually cook them. The gap between saving and making recipes is one of the biggest challenges in digital cooking. (National Frozen & Refrigerated Foods Association)
- Food content engagement on Instagram Reels is 2.3x higher than static food posts, driving a shift toward video-first recipe sharing. (Instagram)
Couples & Family Meal Planning
Meal planning is often a shared household responsibility, but the data shows it rarely feels shared equally.
- 80% of meal planning and food preparation responsibility falls on one partner, typically the woman in heterosexual couples. This "mental load" around food is a growing area of research. (PMC / National Institutes of Health)
- 60% of couples report regular disagreements about what to eat for dinner. The "what's for dinner?" question is one of the most common daily friction points in relationships. (HelloFresh Consumer Survey)
- Families that eat dinner together at least 5 times per week have children with 25% better dietary quality and lower rates of disordered eating. (American Heart Association)
- 68% of parents say meal planning is a significant source of weekly stress. The combination of dietary preferences, schedules, and picky eaters makes family meal planning particularly complex. (FMI – The Food Industry Association)
- Households with shared grocery lists waste 25% less food than those where one person shops alone without input from other household members. (ReFED)
- Only 12% of couples use a shared digital tool for meal planning or grocery shopping. Most still rely on text messages, verbal communication, or paper lists. (Pew Research Center)
How Meal Planning Can Help
The data is clear: meal planning reduces food waste, saves money, and leads to healthier eating. But traditional meal planning (rigidly assigning recipes to specific days) doesn't work for most people. That's why half of new meal planners quit within a month.
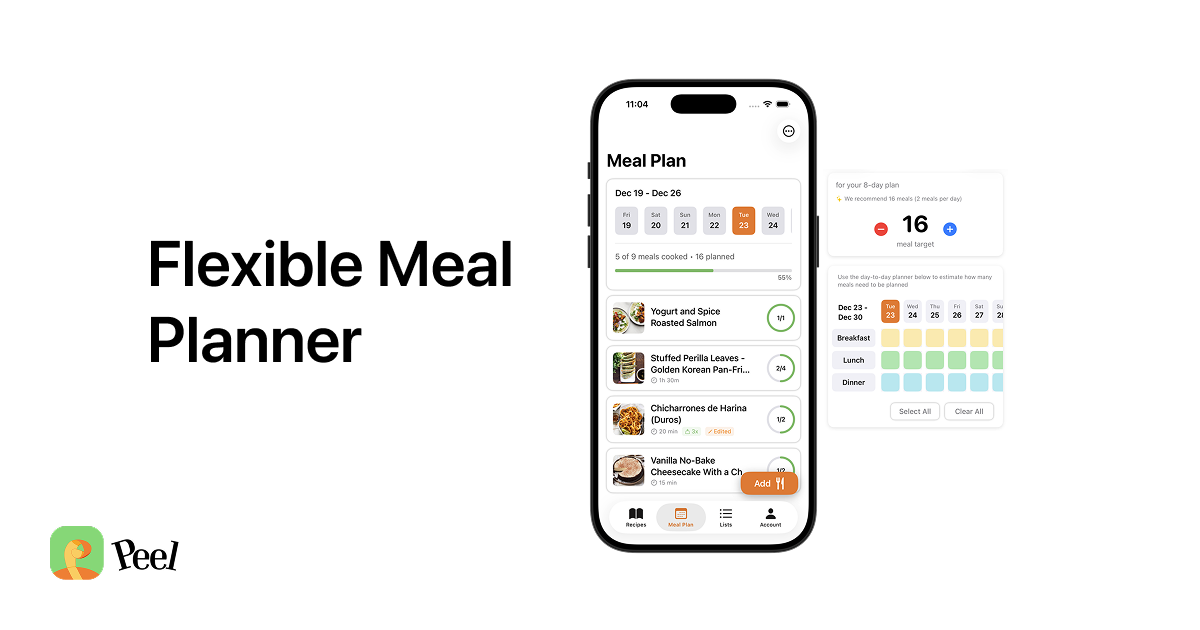
The key is flexible meal planning. Instead of locking in Monday's dinner on Saturday, you build a pool of recipe options for the week and choose based on your mood, your schedule, and what's in the fridge. Learn more about the flexible meal planning method and why rigid meal plans fail.
Tools like Peel's meal pool make this approach easy by letting you add recipes from anywhere (including TikTok and Instagram) and automatically generating a shared grocery list from your selections.
Sources
- USDA. Food Waste FAQs
- EPA. Food: Material-Specific Data
- ReFED. The Problem of Food Waste
- NRDC. Wasted: How America Is Losing Up to 40 Percent of Its Food
- FAO. Food Wastage Footprint
- Bureau of Labor Statistics. Consumer Expenditure Survey
- Bureau of Labor Statistics. Consumer Price Index
- Bureau of Labor Statistics. American Time Use Survey
- Pew Research Center
- FMI. The Food Industry Association
- Morning Consult
- Statista
- HelloFresh Consumer Surveys
- Cornell University Food and Brand Lab
- International Journal of Behavioral Nutrition and Physical Activity
- Public Health Nutrition (Cambridge)
- International Food Information Council (IFIC)
- Food & Nutrition Magazine
- IBISWorld
- Business Research Insights
- TikTok Newsroom
- National Frozen & Refrigerated Foods Association
- PMC / National Institutes of Health
- American Heart Association
Last updated: February 2026